
Interactive Multivariate Tilt Maps for Immersive Exploratory Analysis of Spatiotemporal and Hierarchical Geospatial Data
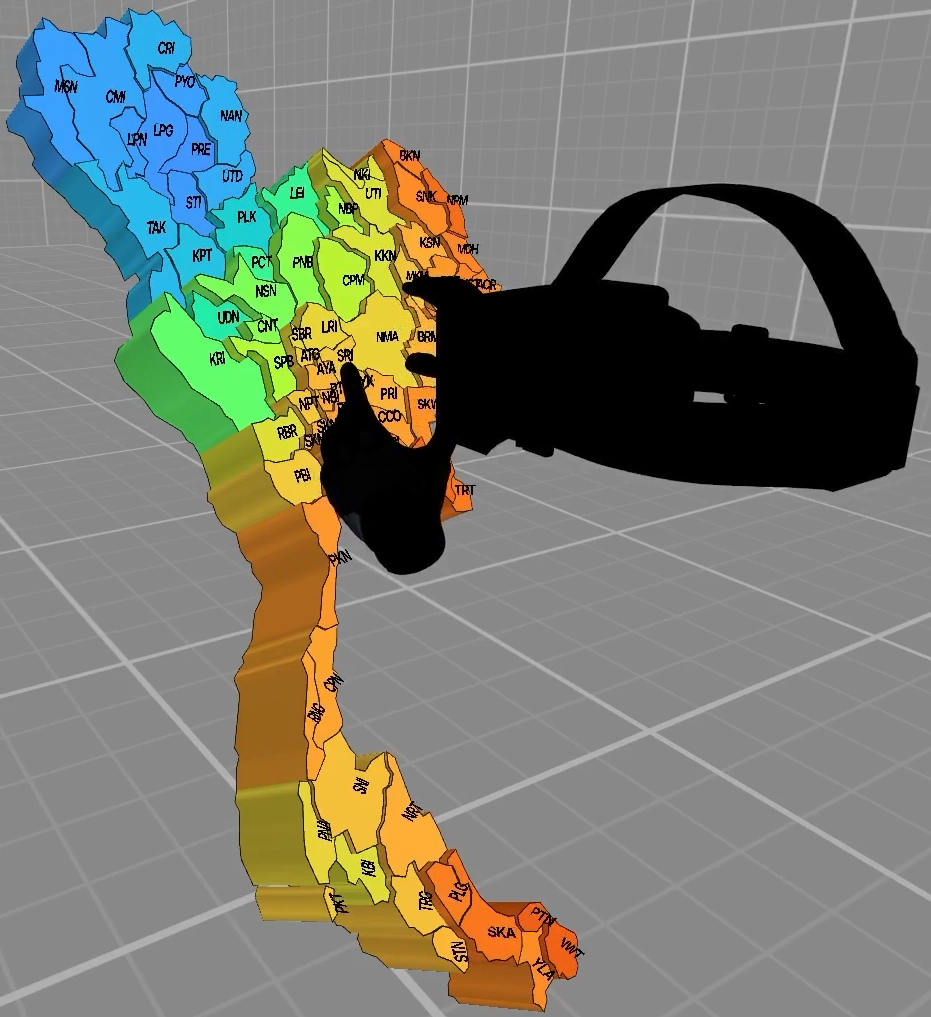
Yang et al.'s Tilt Map [1] smoothly transitions between Choropleth Map, Prism Map and Bar Chart depending on its tilt angle. However, the visualization is limited to one variable at a single point in time, making it difficult to identify relationships between multiple variables. For this reason, I developed the Enhanced Tilt Map in Unreal Engine 5 for the exploratory analysis of multivariate spatiotemporal and hierarchical geospatial data in virtual reality. Multiple variables can be visualized simultaneously using a Single Tilt Map or a Tilt Map Group. A time slider allows the user to explore temporal changes, while a laser supports the reading and comparison of values as well as a drilldown to lower geographic levels.
I compared the two variants of the Tilt Map in a user study with 17 participants using tasks to identify maximum values and detect relationships between two variables. The results show that the Tilt Map Group enables faster identification of maximum values. The Single Tilt Map tends to be better for the identification of relationships.
Description
Figure 1 shows the four views of the Enhanced Tilt Map. It transitions between the views Choropleth Map, Prism Map, Prism Map with Bars and Bar Chart depending on its tilt angle. The Choropleth Map is a two-dimensional map that encodes values using colors. The Prism Map is a three-dimensional map that additionally encodes values using the height of the geographic areas. The Prism Map with Bars represents the geographic areas as bars of equal width and depth at their geographic locations. The Bar Chart arranges the bars next to each other. Users can grab the Tilt Map and switch between the views by changing its tilt angle. Since I was provided with data for Thailand, its provinces and districts, the Enhanced Tilt Map visualizes the corresponding maps.
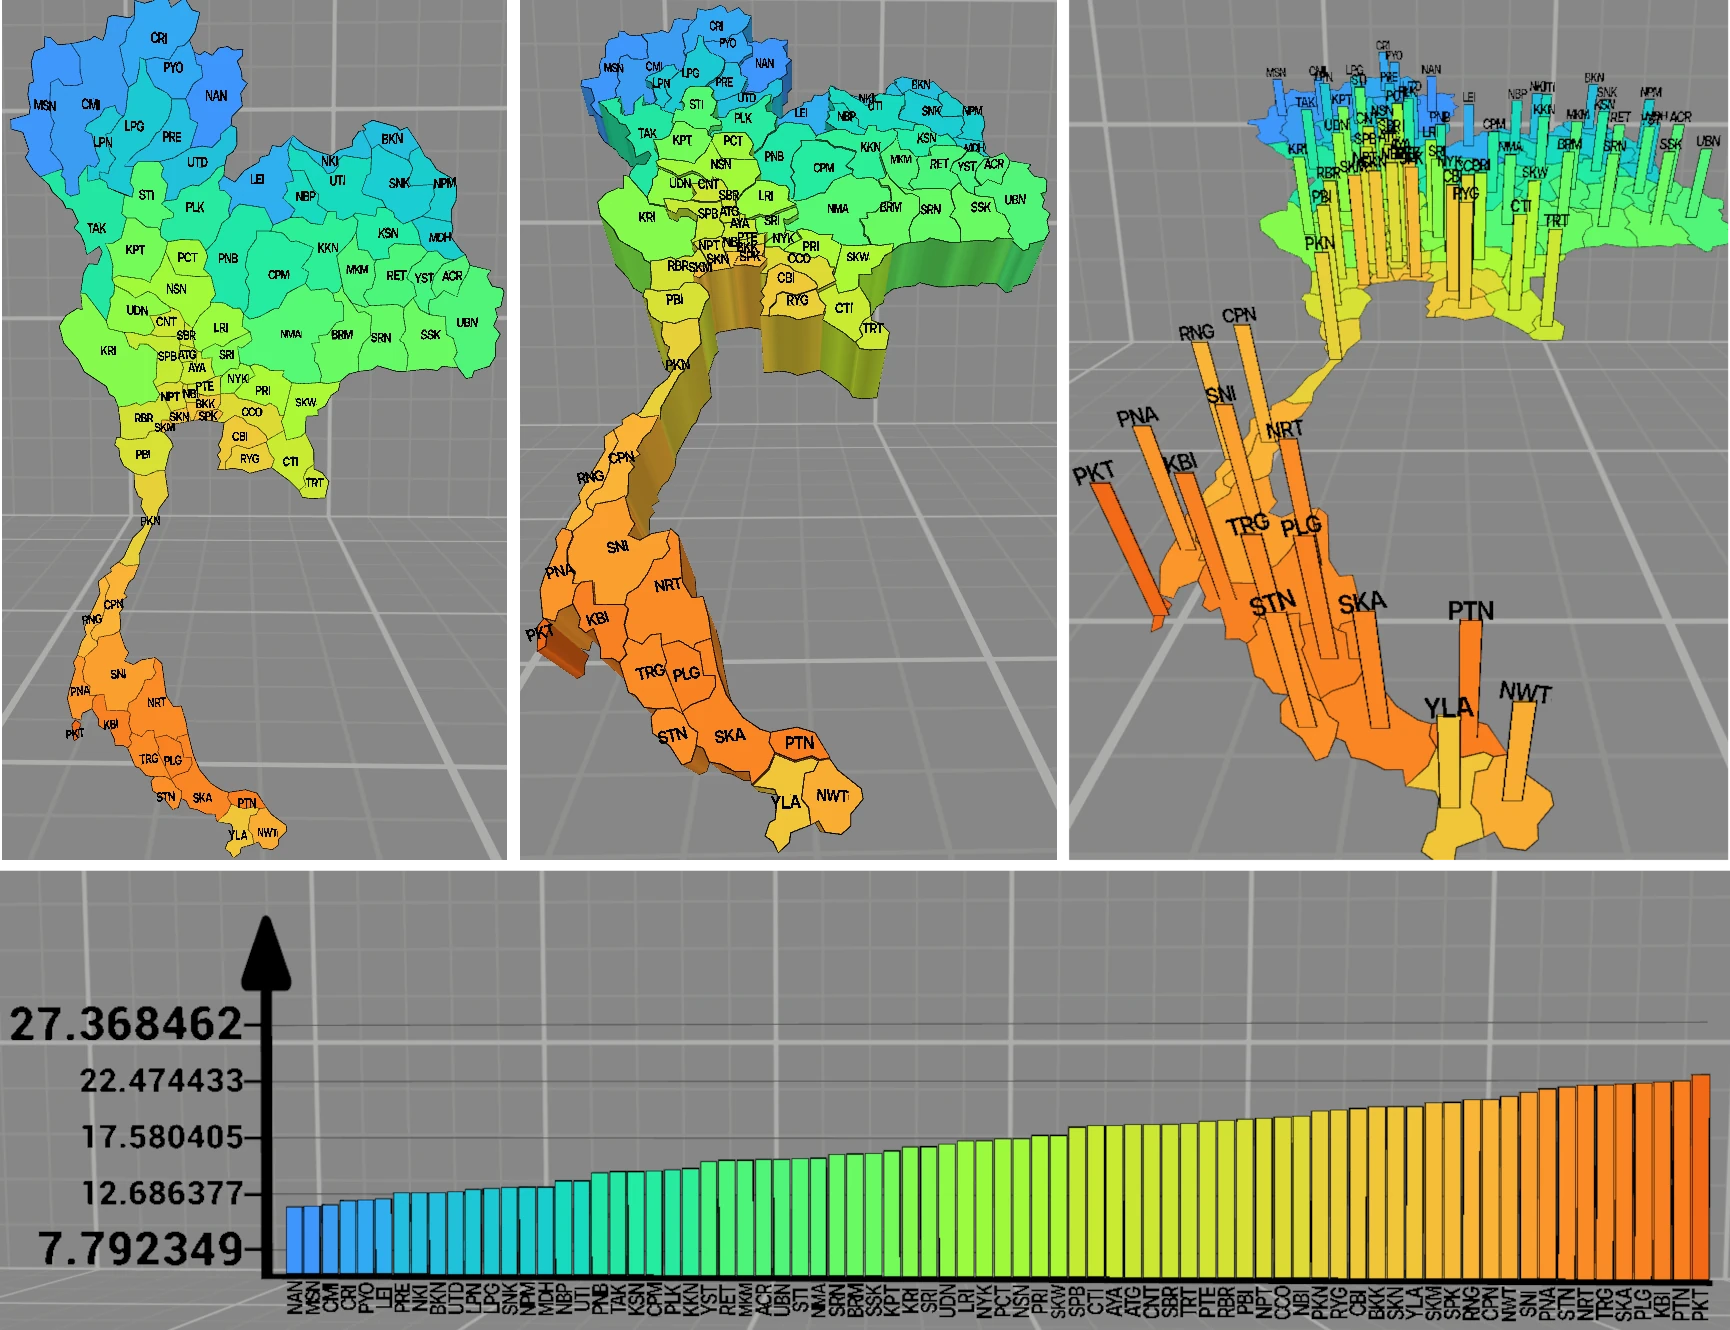
Figure 1: Views of the Enhanced Tilt Map. The top row shows, from left to right, the Choropleth Map, the Prism Map and the Prism Map with Bars. The Bar Chart is shown at the bottom.
Two variables can be explored simultaneously using a Single Tilt Map. It represents one variable using color and one variable using height. Another way to represent multiple variables is a Tilt Map Group. Any number of Tilt Maps can be assigned to a Tilt Map Group. These are arranged next to each other at the same height and are controlled together. The Tilt Map Group displays one Bar Chart for each Tilt Map in the Bar Chart view.
A three-dimensional time slider allows the user to change the current point in time of the visualized data. It is shown in Figure 2. Users can grab the handle and move it to the left to navigate into the past or to the right to navigate into the future. The “-” button to the left of the time slider shifts the time range mapped onto the slider into the past, and the “+” button to the right of the slider shifts the time range into the future. This allows the user to navigate through the entire time range of the dataset.
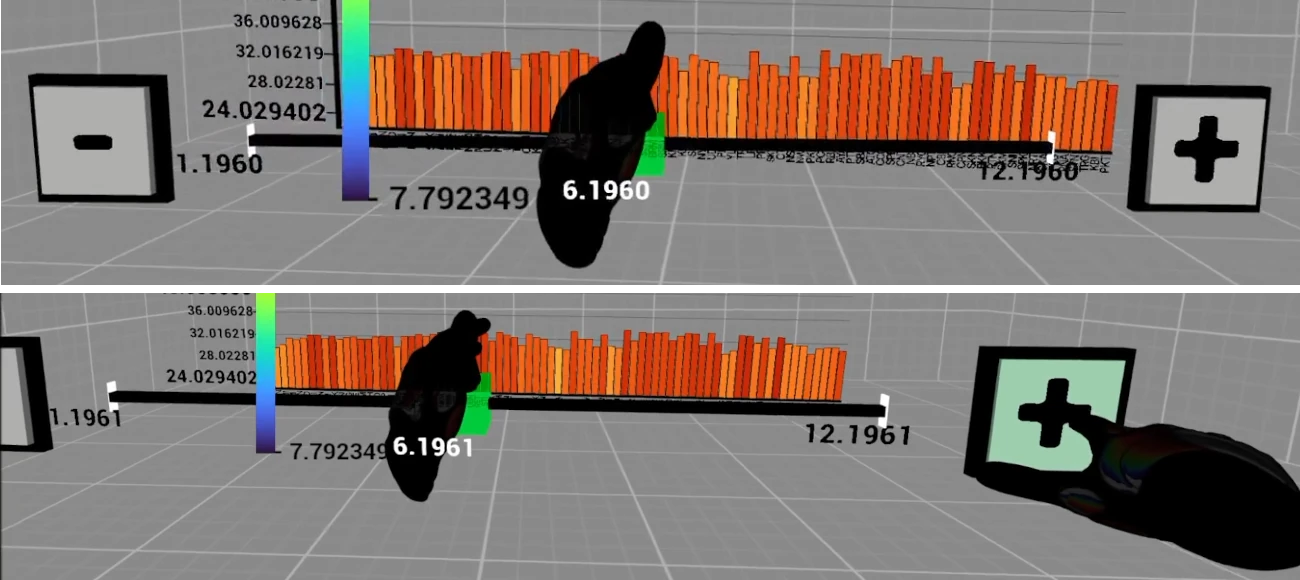
Figure 2: Interaction with the time slider.
The laser can be used to hover over a province. This displays the name of the province and the exact values of its variables. Furthermore, a red guide line appears in the Bar Chart at the same height as the hovered province. The hover of a province and the guide line can be locked, preventing other provinces from being hovered. In a Tilt Map Group, the guide line appears at the same height in all Bar Charts. Figure 3 shows the guide line in a Tilt Map Group. The guide line makes it easier to compare bar heights. Locking the hover also allows the comparison of bar heights at different points in time.
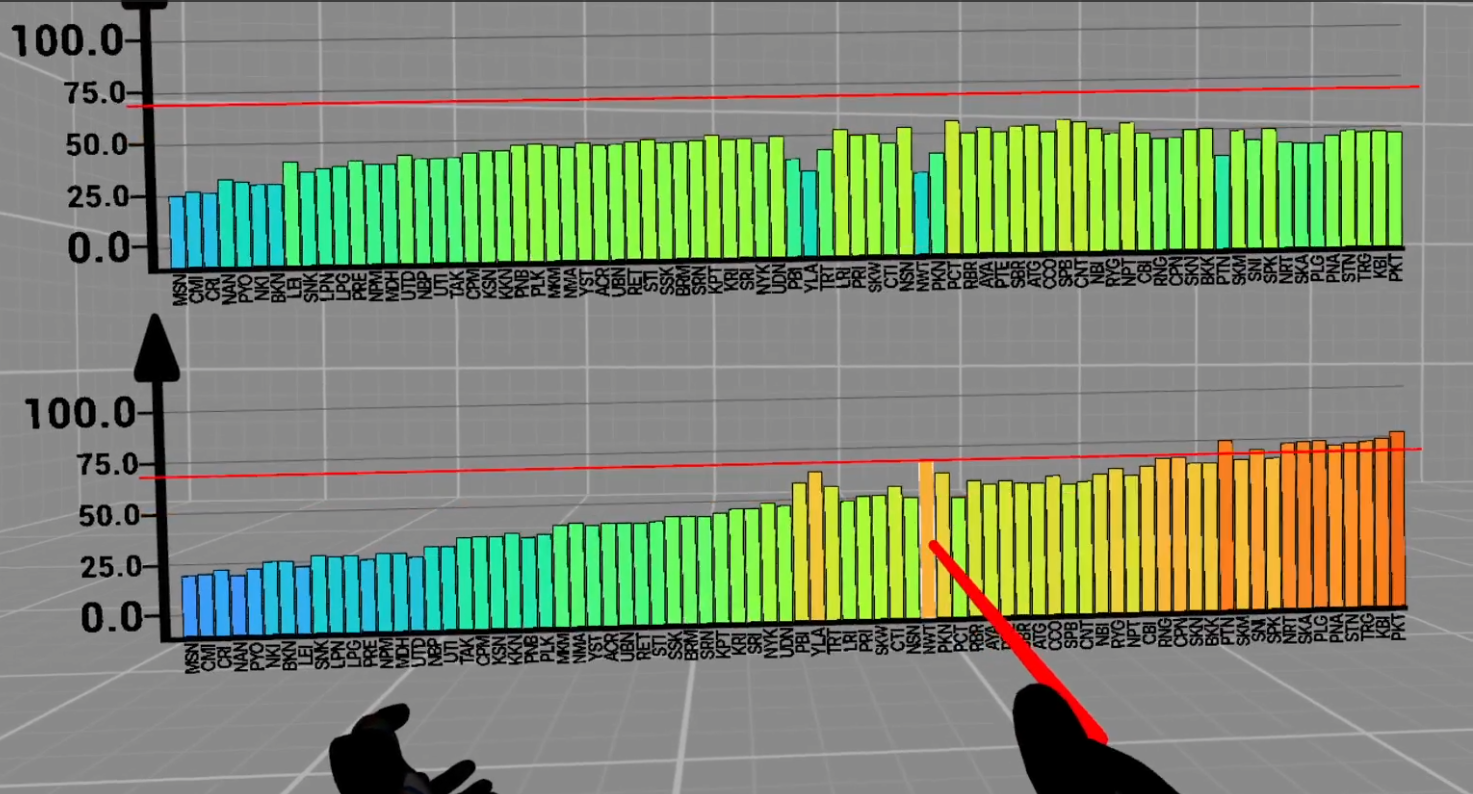
Figure 3: Guide line in a Tilt Map Group.
The data of a Tilt Map can be explored at a lower geographic level using a drilldown. Users can hover over a province with the laser and press the drilldown button. This brings the province into the user's hand. The user can then create and place another Tilt Map of this province showing its districts or cancel the process. Figure 4 shows this drilldown process.
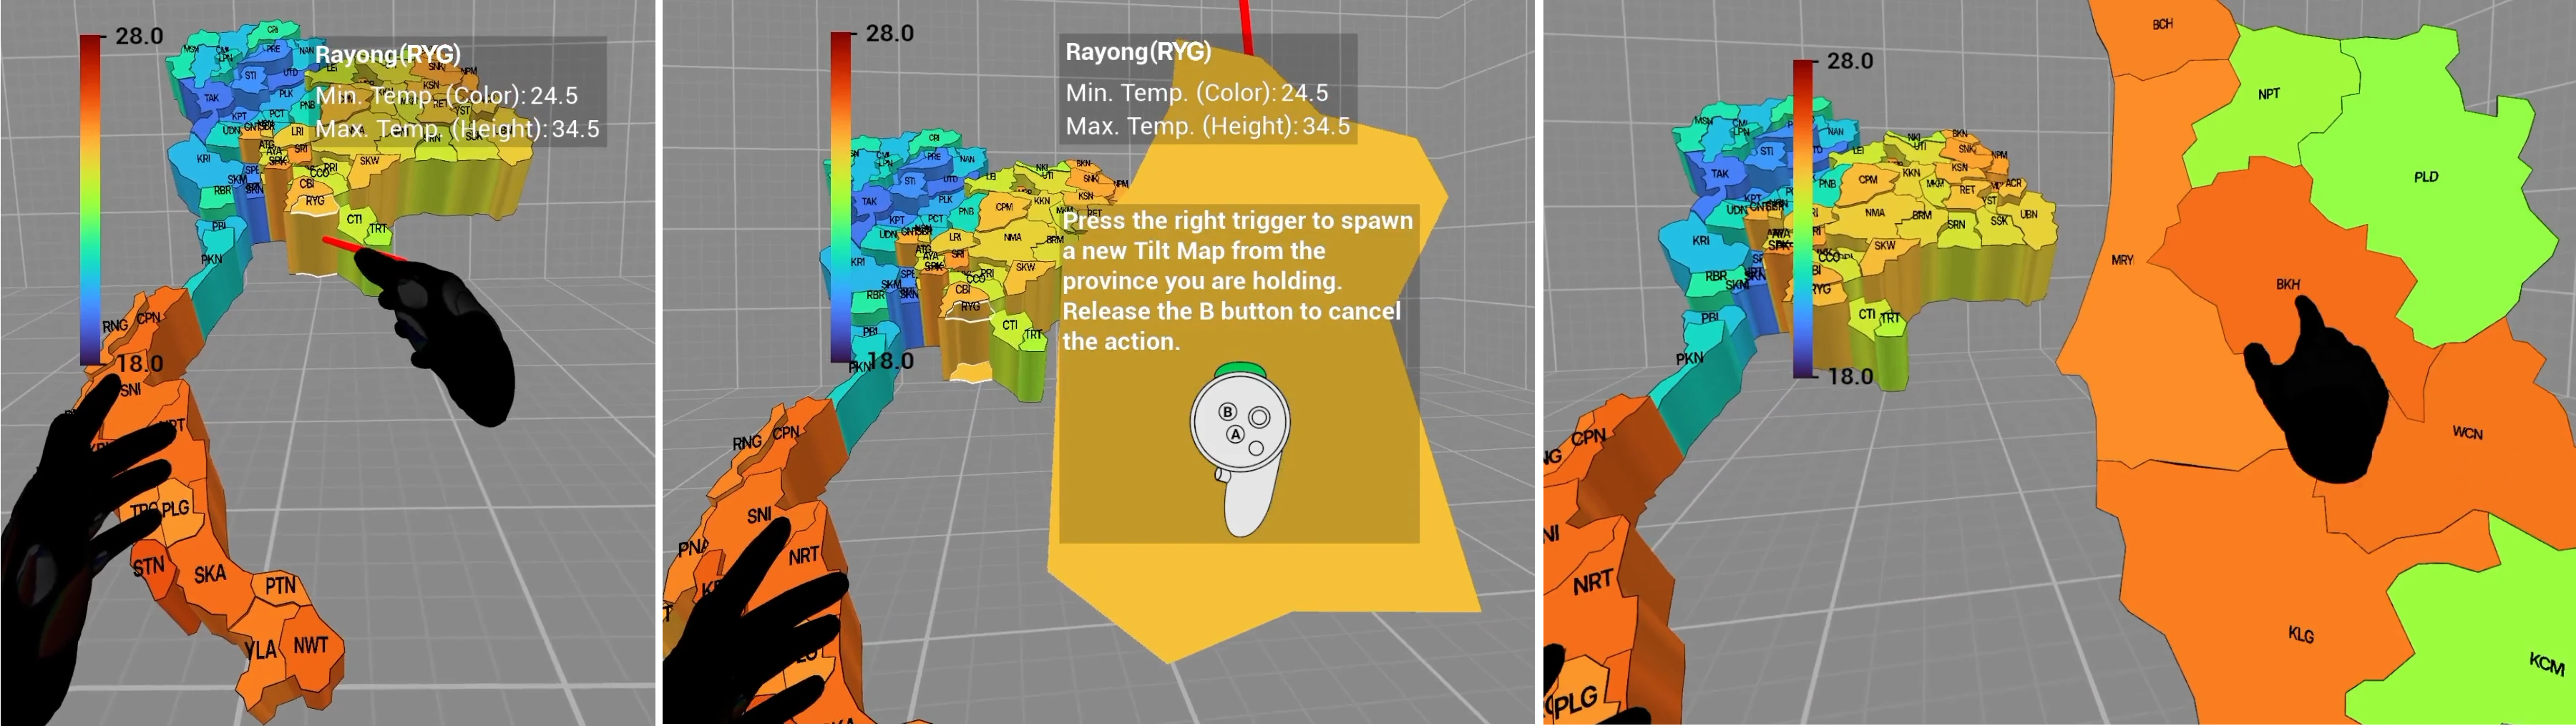
Figure 4: Drilldown process.
The user interface can be used to change the dataset, the variable encoded by color, the variable encoded by height and the current point in time. “Link Color & Height” can be enabled to make color and height encode the same variable. Submenus can be used to configure and create Tilt Maps, create Tilt Map Groups and adjust the properties of the time slider, Tilt Maps and Tilt Map Groups.
User Study: Single Tilt Map vs. Tilt Map Group
In a within-subjects user study (N = 17), I compared a Single Tilt Map of Thailand with a Tilt Map Group of Thailand. The Single Tilt Map visualized two different variables simultaneously using height and color. The Tilt Map Group contained two Tilt Maps of Thailand, with color and height representing the same variable in each Tilt Map. Thus, each Tilt Map in the group visualized one variable. The participants completed two tasks in which they had to identify maximum values (Tasks 1 and 2) and three tasks in which they had to identify relationships between two variables (Tasks 3–5). In Task 3, the values of both variables changed in the same direction (positive relationship). In Task 4, they changed in opposite directions (negative relationship). In Task 5, there was no relationship between the variables.
During the tasks, the correctness of the answers, task completion time, participants' subjective confidence in their answers, use of the views, interaction and movement data were collected. Additionally, the perceived workload was measured using the NASA-TLX [2] without weighting the dimensions. Finally, the participants answered comparison questions between the Single Tilt Map and the Tilt Map Group.
Results
All 17 participants answered the tasks on identifying maximum values correctly with both Tilt Map variants. Most participants were very confident in their answers. The task completion time is significantly shorter with the Tilt Map Group for both tasks. In Task 1, the median task completion time is 47.9 seconds (IQR = 29.4) with the Single Tilt Map and 27.0 seconds (IQR = 14.9) with the Tilt Map Group. In Task 2, the median is 99.9 seconds (IQR = 66.5) with the Single Tilt Map and 84.6 seconds (IQR = 36.7) with the Tilt Map Group. Figure 5 shows the task completion times for Tasks 1 and 2. They are shown as boxplots for the Single Tilt Map and the Tilt Map Group. The points represent the participants' task completion times. The lines connect the values of the same participant.


Figure 5: Task completion times for Tasks 1 and 2.
For all three relationship tasks, there is no significant difference in the correctness of the answers. Nevertheless, more correct answers were given with the Single Tilt Map in all three tasks, indicating a tendency in favor of the Single Tilt Map. In Task 3, 16 of 17 participants answered correctly with the Single Tilt Map and 15 with the Tilt Map Group. In Task 4, 16 correct answers were given with the Single Tilt Map and 14 with the Tilt Map Group. In Task 5, 14 participants gave a correct answer with the Single Tilt Map and 11 with the Tilt Map Group. There is no significant difference between the variants in subjective confidence. The participants were mostly confident to very confident in their answers. There are also no significant differences in task completion time between the Single Tilt Map and the Tilt Map Group. Figure 6 shows the participants' task completion times for Tasks 3 to 5. Incorrect answers are marked with a cross.


Figure 6: Task completion times for Tasks 3–5.
Figure 7 shows the average distribution of task completion time across the views for each task. For all five tasks, the participants spent most of their time in the Bar Chart view. For the tasks on identifying maximum values, the average proportion of task completion time spent in the Bar Chart ranges from 57.1 % to 82.1 %. In the relationship tasks, it ranges from 44.8 % to 60.0 %.


Figure 7: Average distribution of task completion time across views for Tasks 1–2 (left) and Tasks 3–5 (right).
Interaction and Movement Data
For view changes, laser use and distance traveled, there are no significant differences between the two variants in any task. A significant difference occurs only for rotation in Task 1. In this task, rotation per minute was higher with the Tilt Map Group than with the Single Tilt Map. In the remaining tasks, there is no significant difference in rotation between the variants.
NASA-TLX
Figure 8 shows the results of the individual dimensions of the NASA-TLX. There are no significant differences between the variants in either the unweighted overall score or the individual dimensions. The median overall score is 30.8 (IQR = 21.7) for the Single Tilt Map and 36.7 (IQR = 19.2) for the Tilt Map Group. In both variants, mental demand has the highest rating. Physical demand, temporal demand and frustration were mostly rated low.

Figure 8: Results of the NASA-TLX.
Preference of the participants
Although the participants gave more correct answers with the Single Tilt Map in every relationship task, the majority preferred the Tilt Map Group. In the final comparison questions, the Tilt Map Group was preferred more often than the Single Tilt Map in every aspect. These aspects included reading individual values, identifying relationships, visual structure and interpretation. Overall, the Tilt Map Group was also preferred. The chosen answers are shown in Figure 9.

Figure 9: Participants' preferred variant across different aspects.
The Single Tilt Map and the Tilt Map Group have different strengths. Therefore, the choice between them should depend on the goal or task. Maximum values can be identified more quickly with the Tilt Map Group. The Single Tilt Map tends to be better for the identification of relationships.
Files
Full version of the master's thesis (German only)
Presentation of the thesis defense (German only)
The Windows application of the Enhanced Tilt Map can be downloaded here
The Unreal Engine project of the Enhanced Tilt Map can be downloaded here (Unreal Engine 5.4.4 required)
References
[1] Yang, Y., Dwyer, T., Marriott, K., Jenny, B. and Goodwin, S. (2021). Tilt Map: Interactive Transitions Between Choropleth Map, Prism Map and Bar Chart in Immersive Environments. IEEE Transactions on Visualization and Computer Graphics, 27(12):4507–4519.
[2] Hart, S. G. and Staveland, L. E. (1988). Development of NASA-TLX (Task Load Index): Results of Empirical and Theoretical Research. In Hancock, P. A. and Meshkati, N. (Eds.), Human Mental Workload, Vol. 52 of Advances in Psychology, pp. 139–183. North-Holland.
License
This original work is copyright by University of Bremen.
Any software of this work is covered by the European Union Public Licence v1.2.
To view a copy of this license, visit
eur-lex.europa.eu.
The Thesis provided above (as PDF file) is licensed under Attribution-NonCommercial-NoDerivatives 4.0 International


 .
Any other assets (3D models, movies, documents, etc.) are covered by the
Creative Commons Attribution-NonCommercial-ShareAlike 4.0 International License.
To view a copy of this license, visit
creativecommons.org.
If you use any of the assets or software to produce a publication,
then you must give credit and put a reference in your publication.
If you would like to use our software in proprietary software,
you can obtain an exception from the above license (aka. dual licensing).
Please contact zach at cs.uni-bremen dot de.