
Publications
Additional Material
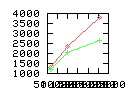
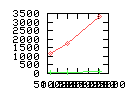
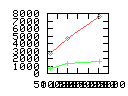
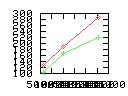
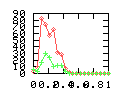
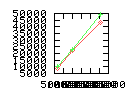
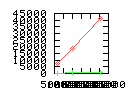
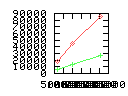
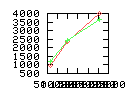
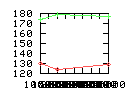
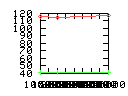
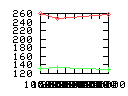
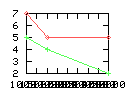
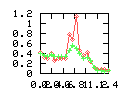
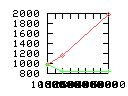
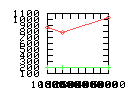
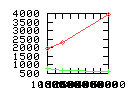
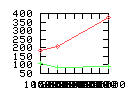
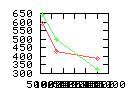
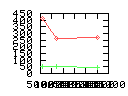
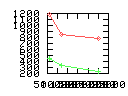
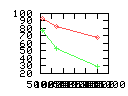
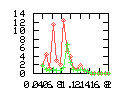
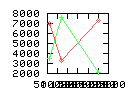
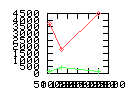
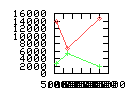
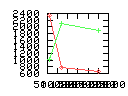
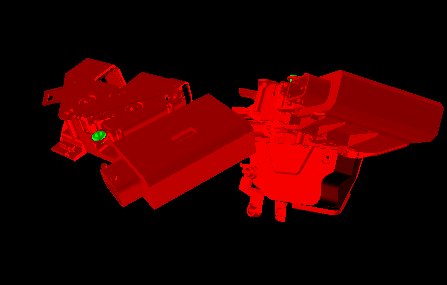
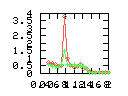
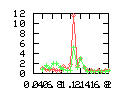
Here are some additional plots showing various aspects of a comparison of the performance of the old traversal scheme (red) and the new one (green):
| Average | Maximum | ||||||||||
|---|---|---|---|---|---|---|---|---|---|---|---|
| Object | Obj name | Time | Num overlap tests | Num DOP transforms | Num nodes visited | Num pgon intersection tests | Time | Num overlap tests | Num DOP transforms | Num nodes visited | Num pgon intersection tests |
 |
Cover (Abdeckung), 30477 polygons each | 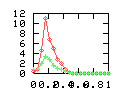
| 
| 
| 
| 
|
| 
| 
| 
| 
|
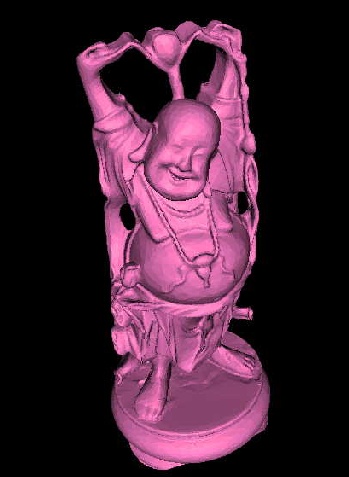 |
Happy Buddha (buddha), 125,000 polygons each | 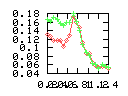
| 
| 
| 
| 
|
| 
| 
| 
| 
|
 |
Front Light (scheinwerfer), 30075 polygons each | 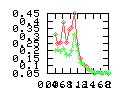
| 
| 
| 
| 
|
| 
| 
| 
| 
|
 |
Door Lock (schloss), 26136 polygons each | 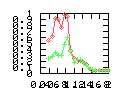
| 
| ||||||||
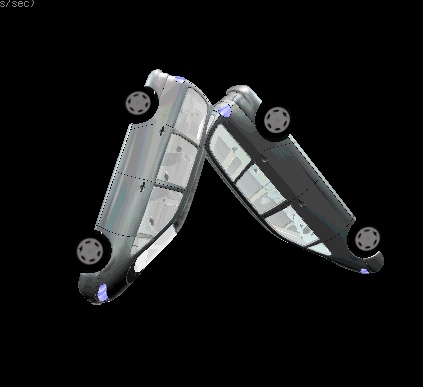 |
Car Body (sharan), 28167 polygons each | 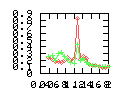
| 
| ||||||||
Benchmarking procedure: two identical objects are positioned at a certain distance d = dstart from each other. The distance is computed between the centers of the bounding boxes of the two objects; objects are scaled uniformly so they fit in a cube of size [-1,+1]3. Then, one of them performs a full tumbling turn about the z- and the x-axis by a fixed, large number of small steps (5000). With each step, a collision query is done, and the average collision detection time for a complete revolution at that distance is computed. Then, d is decreased, and a new average collision detection time is computed. The collision detection algorithm always stopped whenever the first pair of intersecting polygons was found.
Explanation of the columns:
- Time: average collision detection time for a certain
distance; the average was taken over many collision queries with
different object orientations (see above).
- Num overlap tests: average number of BV pair overlap tests during
one collision test.
- Num DOP transforms: average number of DOP transformations that are
performed during one collision test.
- Num nodes visited: total average number of BV tree nodes that are
visited during one collision test; this counts both tree's nodes, and
multiple visits of the same node are counted multiple times. So, this
number is proportional to the amount of data that must be transfered
from memory during collision test.
- Num pgon intersection tests: average number of polygon-polygon
intersection tests; this is the number of leaf pairs that are reached
during one collision test without finding a collision.
The maxium columns are exactly the same as the average, except that here, the maximum over all rotations (with one distance) is listed.