Heat Map
As part of the master project, the heatmap team worked on the representation of grasps in form of a heatmap and a forcemap. It is about grasping objects in VR to find out where and how strongly objects should be grasped. For this purpose, an own method of generating these heat- and forcemaps was developed and implemented resulting in an innovative approach.
Heat Map
To understand human grasping behaviour, it is important to look at the interaction with
different objects. We need to recognize where and how objects are touched and held. Since
what seems intuitive for humans is very complex in robotics, for instance. After all, how is a
robot supposed to know that a cup is touched differently than a cereal box. Using Heatmaps
on various objects, it is possible to teach an artificial intelligence how to touch different
objects.
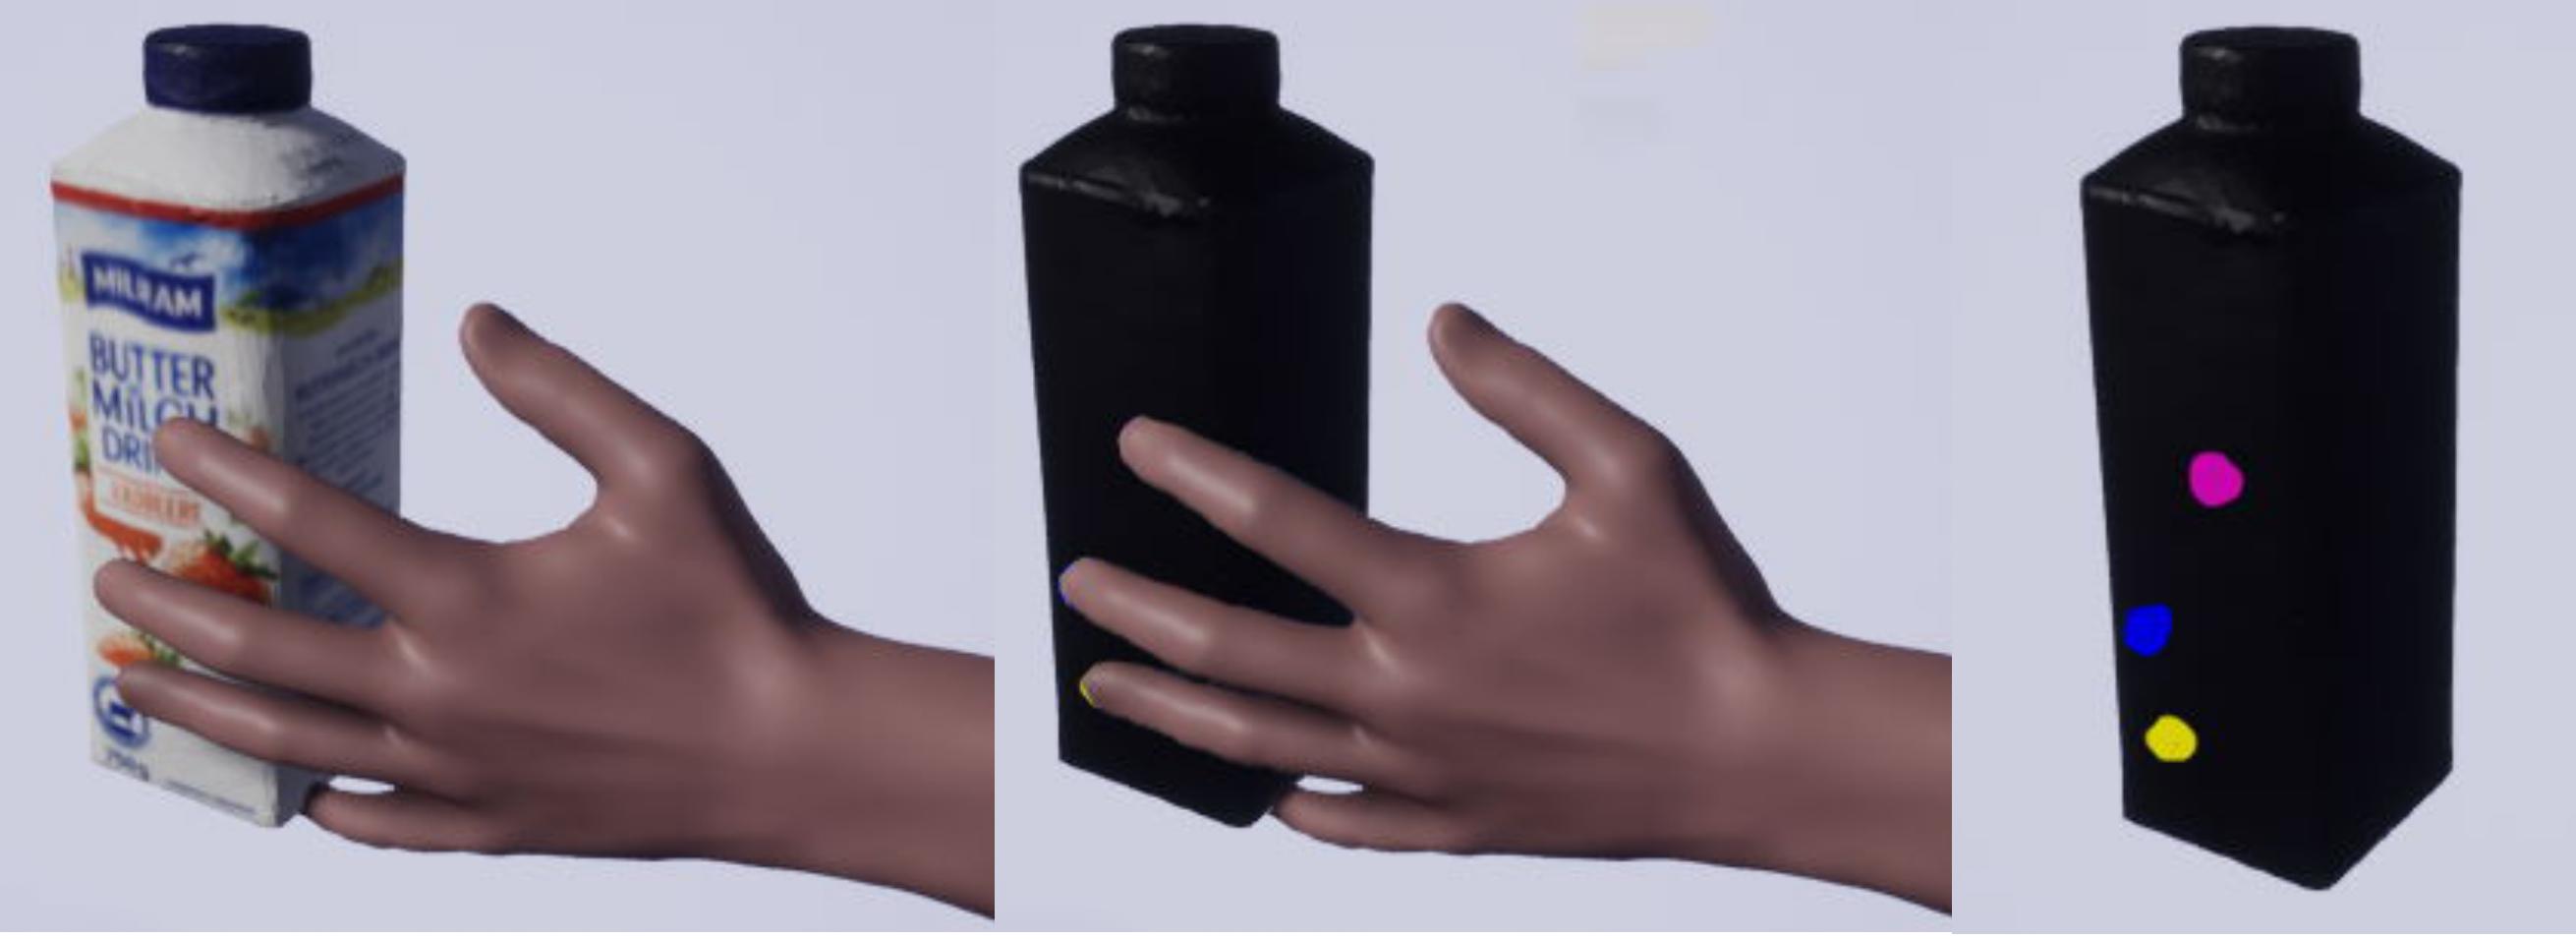
To prevent mixing of colors, there should be one dominant color at each pixel. To implement
this idea, a grid was placed on the object as a texture, whose individual cells should
represent a pixel. In the implementation, the grid is implemented in the form of an array of
numbers, whose content states how often it was touched by which finger. From this it can
be decided which is the dominant finger and thus determines the color. To determine the
dominant finger of each pixel, the imported collision data is looked at. With the coordinates
of the stored collision data from the imported JSON file, it is possible to investigate the
collision for each pixel. The finger that was most often on this pixel is the dominant finger.
To find the point on the surface of the object, a ray the size of the collided sphere is cast
onto the surface. This excludes the possibility of mixing colours and thus ensures clear
identification of the fingers.
With this Heatmap it is now possible to analyse where different objects are touched and
how often they are touched. The colours represent each finger, making it easy to see how
the object was held. The Heatmap is calculated using only the fingertips meaning other finger
parts are omitted
from this calculation. Under these circumstances, Heatmaps using the whole hand would
most likely result in different Heatmaps. As this hasn't been thoroughly tested yet, it can't be
stated what a Heatmap with all finger parts would look like
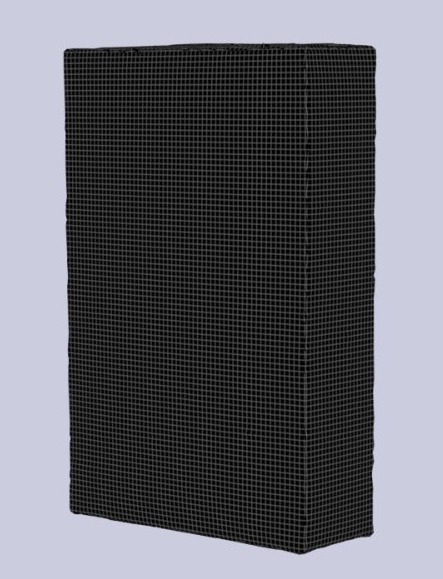
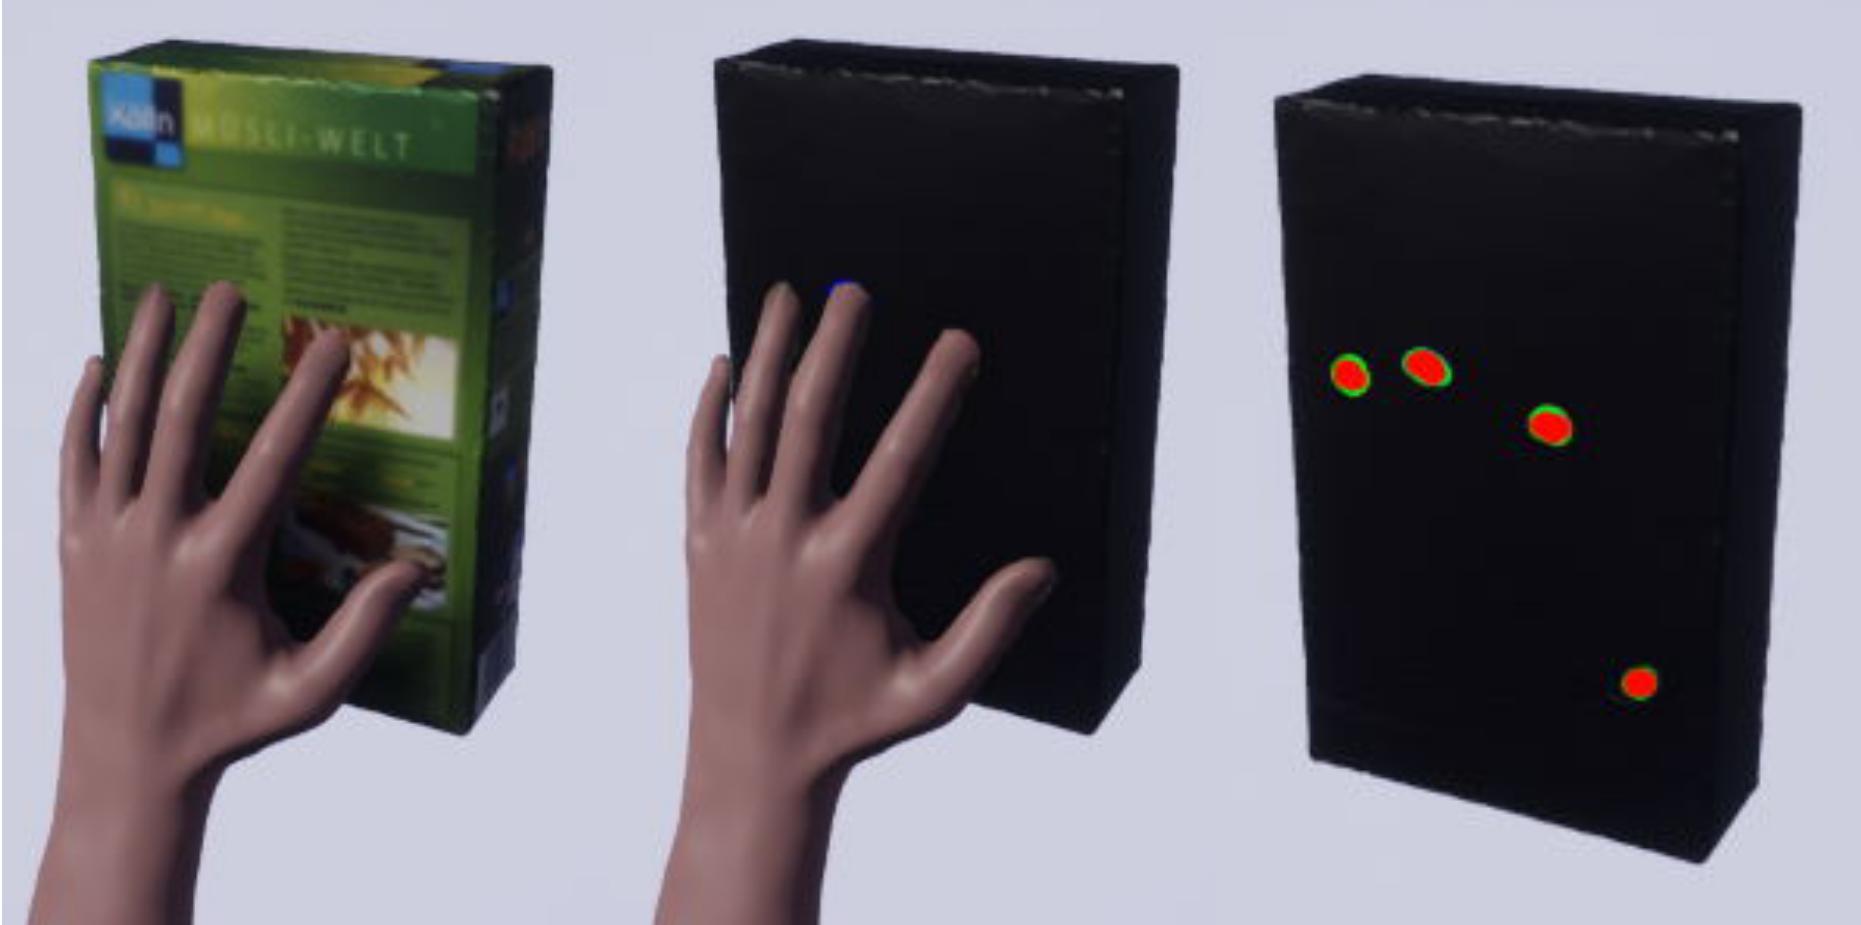
Force Map
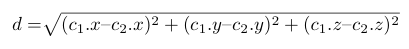
Another important variable to understand human grasping behaviour is the applied force when lifting different objects. After all, one could destroy a milk carton with too much force applied while lifting it. To represent the applied force, a Forcemap was developed as part of this work, showing at which point how much force had to be applied to the object. The generation of the Forcemap works similar to the previous Heatmap with a grid whose cells reflect the pixels and are coloured accordingly. Here, a lot of force is displayed in red and little force in green. Unaffected points are coloured black. To enable a transition of the colours, the colours are assigned in steps of 10% of the force. Thus, orange and yellow represent a medium strong force. To generate the Forcemap, the force had to be calculated for every pixel, i.e. for every cell in the grid. In order to calculate the applied force, the two colliding spheres with their coordination data and radius are needed. The distance between the centres of both spheres d can be calculated from the coordinates as follows:
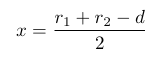
The penetration depth x is searched for and reflects the applied force. The penetration depth describes how strongly the spheres collide, where a stronger collision stands for more applied force. The penetration depth is calculated using the radius r1, r2 and the distance d as follows:
With the Forcemap we introduced a new way of indicating force in a digital way. Not only the calculation but the visualization is a completely new approach. The result of this is a supportive visualization which can be beneficial in the field of robotics as it's an indication of applied grasp forces. Our way of calculating the force by measuring the penetration depth has not been compared with real grasps. It thereby just provides the way of calculating the penetration without indicating a correlation to real grasps. This means that our work on the Forcemap can't be compared to a measurement of force like Newton
Experiment
To test the heatmap and forcemap, the heatmap/forcemap plugin was added to the comparison team's experiment. The participants were only asked to intuitively touch an object in VR for the data to generate the heatmap and forcemap. The prerequisite here is, of course, that the object is seen from the same perspective by all participants. From the collected data, the heat and forcemap can later be generated and should then provide informative results that can be interpreted afterwards.