
Cutting-edge computer games use different graphics subsystems -- so-called 3D graphics engines. Source (used in Half Life 2), Unreal Engine (Unreal Tournament), idTech 4 (Doom 3), CryENGINE2 (Crysis) or Clever's Paradox engine are well-known among the players and the game industry experts.
It's time to learn a new 3D game engine named: Microsoft Excel.
It is understood that Excel is an all-round office tool, but probably it is unknown that it has a bunch of features that makes Excel a high-class 3D graphics engine.
In this article I will demonstrate Excel's arithmetical facilities, the embedded rendering subsystems (there are two of them!) and the revolutionary approach which might just cause a paradigm shift. I hope you will discover that Excel effectively and efficiently incorporates practicality, tons of features, the multi-platform portability and the high performance with the unique and futuristic 3D engine features.
The chapters even have demo programs and movies created with the Excel 3D engine.
Warning: Only for determined experts!
Maybe Excel's arithmetic functions need a demonstration least of all. The core functions of the 3D object manipulation (e.g. the four rules of arithmetic, trigonometric functions, matrix algebra) mean the essence of Excel - but it is worth examining them because of their unequalled compactness and its magnificent elegance with which Excel towers above the current entire 3D engine field.
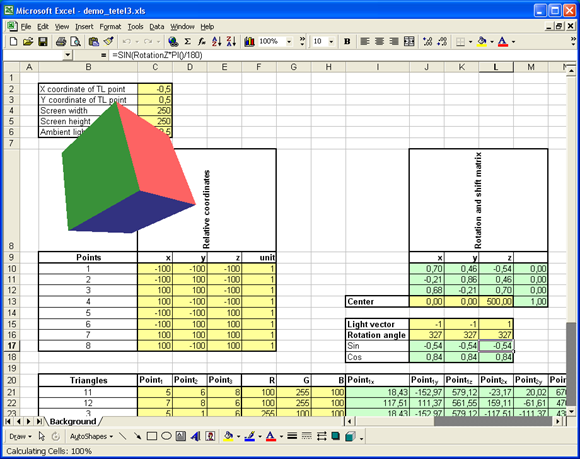
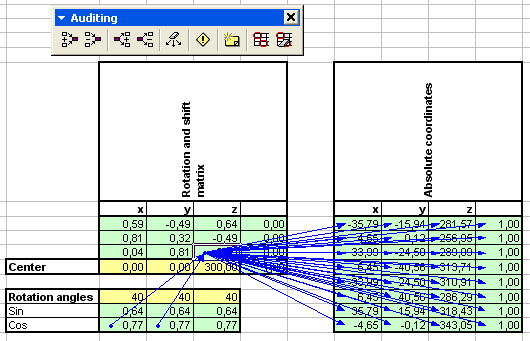
It is very likely that not too many game engines solve the whole 3D arithmetic in a half screen size. The upper part of Figure 1 contains the spatial shift, the rotation around X, Y, Z axis and the perspective projection as well. As it can be seen in the demo applications, the polygon visibility, the Z-buffering and the reflection calculation require about the same size.
The yellow color marks the user-defined parameters and green color indicates the engine-calculated values. Numbered areas contain the following data:
The development environment of Excel not only allows the programmers to edit a plain or syntax-highlighted source code, but it also provides all of its well-known formatting functions for the engine developers: several fonts can be used simultaneously (with different types and sizes), the cells and texts colored, pop-up notes added, and -- sit down! -- sounds or even entire movies inserted if required.
Developers can choose between two rendering subsystems:
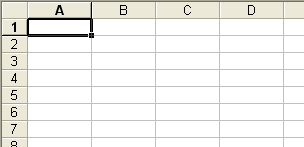
Forget for an instant that after starting Excel we can see a worksheet on the screen which consists of cells, and that the cells contain our data, texts and formulas. Consider this worksheet as the screen of the engine and the cells as the pixels of this screen. Based on this unusual approach:
Worksheet=Screen of the engine
Cells=Pixels
No doubt it is an astounding approach, and it would only be proper to ask how these bulk rectangle-shaped cells can be considered as pixels -- but we will see that these rectangles are only demonstrating a unique feature of the cell graphics, in fact, and the usual small, old-school, square-shaped pixels can be used as well -- if required.
Put away your aversion and have a look at the ECG features:
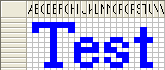
Pixels can be resized, so if someone wants to travel back in time and would like to use the small, old-school square-sized pixels of the traditional 3D engines then he/she can do it easily (please see Figure 2 and 3).

It should be noted that this innovation is such an organic part of the system that it is possible to use pixels with different sizes in each row and column, as can be seen in Figure 4.

The best example of this exceptional resizeability is Excel's default setting, where the pixels are so distorted and rectangle-shaped that it is very easy to confuse them with a data entry field.
Most users do not even realize these are pixels, and see only data entry fields!
It can be said that the Excel-native Cell Graphics surpasses its time and contains a lot of unique and unmatched features which are not accessible in other 3D engines: resizeable pixels, arbitrarily variable aspect ratio, 16.7 megapixel resolution, switchable sub-pixel size grid lines.
On the figure below (Figure 7) the engine can be seen in action (with rendered gridlines). You can start the demo by grabbing our example Excel engine files (enable the macros when Excel asks), pressing the ALT+F8 keys and running the ECG_Demo.
The drawback of the ECG is the speed and the absence of some common graphical functions (e.g. line drawing, texture mapping, etc) that must be implemented by the developers.
If there is no need for ECG's advanced features, like resizable pixels and variable aspect ratio then Excel's other rendering subsystem -- the Office-level Graphics Abstraction Layer -- is a possible choice.
OGAL provides additional functions (polygon drawing, filling, etc), higher performance and compatibility with other applications of the MS Office package. This compatibility can be extremely useful if the 3D application has to be ported to (e.g.) Word.
A curiosity of the rendering process is that rendering is performed on a separate layer in front of the worksheet, so the subsystem can work without modifying the existing content of the worksheet.
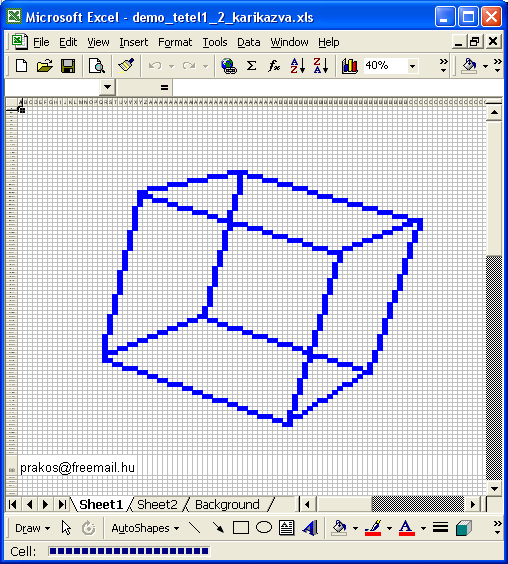
This feature makes it possible to run OGAL and ECG side by side, or show the background calculations and their results on the same screen -- which helps the debug process. A screenshot of the running OGAL subsystem can be seen below (Figure 8).
The separate rendering layer in front of the worksheet is easily observable on the picture: while the rotating cube is rendered on this layer, the 3D calculations performed by the engine can be seen in the background.
A typical example of the OGAL subsystem's refinement is the available polygons: whereas the current 3D engines operate with triangles, the OGAL supports other polygons (like quadrangles, pentagons, etc.) as well.
There is no need for a separate background buffer because it is handled by OGAL. Colors can be set by the usual 24 bits and the subsystem provides an additional alpha channel for the transparency as well. Again, the demonstration file is available in our example Excel engine files - for those who shun real-time, here's a video of it in action:
Warning: Only for very-very determined experts!
Sequentiality essentially influences our actual programming paradigm. It can be found in every corner of the programming vocation: day by day thousands of programmers code their algorithms row-by-row, create the executables step-by-step (as defined in the makefiles), debug the executables command-by-command.
Thousands of different programs and billions of source code lines were created with this sequential approach. Sequentiality pervades our current programming paradigm so much that programmers don't question its reason for existence and take its limitations for granted.
Note: Please don't underestimate the power of habit! Probably you have a QWERTY keyboard in front of you which has intentionally the most uncomfortable button layout!
It's not a joke: the QWERTY layout was originally created for the typewriters in the 1860s when the jam was a difficult technological problem. The QWERTY layout ensures that successive keystrokes alternate between sides of the keyboard. This layout helps to solve the typewriters' jam problem but it causes the greatest possible demands on your fingers and joints. The wind of change has blown away the typewriters and their 150 year-old technological problems but we still use the most uncomfortable keyboard layout these days!
It is the power of habit.
(For further information visit http://en.wikipedia.org/wiki/Dvorak_Simplified_Keyboard)
Excel breaks with this habit and exceeds sequentiality. Its revolutionary approach can be observed in the following fields:
It is commonly accepted among developers that source code (and the algoritms encoded in source code) handled by the current development tools require a sequential top-down reading and interpretation. Figure 9 illustrates this sequential top-down interpretation.
We accepted this sequential, top-down mentality so much that interpretation of an unusually formatted (but syntactically correct) source code can be immensely hard. If you would like to test your thinking then you can find some challenging examples at http://www.textrush.com/code-formatting.htm. These examples are suitable only for the very determined readers, as they contain unusual line-breaks and tabulators as well.
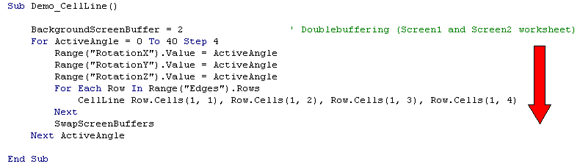
Excel supports this traditional sequential top-down approach in the VBA codes (see the example on the previous page) and additionally it provides a very new, fresh and revolutionary opportunity as well. Working on the worksheets, programmers can use the two dimensions of the sheets, and they can use the directions absolutely freely.
This means that the algorithms can be encoded horizontally (see the 1st figure where the steps of the 3D transformation is interpreted from left to right) or from bottom to top or even in L-shaped knight's move. Excel does not force you into traditional top-down sequential coding -- therefore it provides exceptional freedom for programmers.
It can be said that Excel opens totally new dimensions in the representation of algorithms. We cannot even see the borders of these new opportunities! Soon we may measure not only the length of the source code (see SLOC) but the width of it as well (what will complement the SLOC numbers?). Furthermore, it may open the way to n-dimensional source code, and we might talk about the depth or height of the source code, too.
Excel breaks with the sequentiality of the source code interpretation with another new feature as well: with cell references programmers can see the dependencies of the source codes easier, not only row-by-row but simultaneously, and can quikly overview the source code.
Cell references allow the programmer to check what other data affects a selected variable (e.g. Figure 10 shows how the 3D transformation matrix is determined by the cosinus of the X and Y rotation angles) and they can check what other variables are affected by selected data (e.g. the selected transformation matrix element affects all the 3D values). If it is needed then the chain of the impacts defined in the algorithms can be shown in both directions.
Termination of the sequentiality can be observed during the debugging process as well. With the current development tools programmers must follow the execution of the program step-by-step to observe the real (and not only the intended) behaviour of the program and the algorithms.
They can use some useful tools (breakpoints, step in/step out, etc.) to make this process faster and more comfortable but sequentiality is built into our programming paradigm and it slows down the debugging process.
Opposing to this Excel's Autocalc function shows the execution of the algorithms ”unfolded” and the effects of all steps in all variables can be seen immediately without the need of step-by-step debugging. This feature drastically decreases the overhead times and increases the productivity of the programmers.
Probably all programmers experienced that annoying and obsolete trait of actual development tools -- like the results of the modifications cannot be seen immediately, and some sequential steps must be performed to get these results.
In a typical situation a programmer has to...
...and will get the result only after these steps.
These steps can consume such a huge amount of time that specialized tools increasing the speed of the compilation (e.g. Incredibuild) became very popular. In case of small and frequent modifications this workflow can lead to a huge amount of overhead compared to the substantive and useful work.
We are so used to this workflow that we do not even expect it to be easier.
Not surprisingly Excel breaks with this workflow and uses a revolutionary approach again. Thanks to its Autocalc function the editor, the compiler, the linker and the runtime environment are integrated on such a high level that is unpaired among current tools.
After changing a formula in a cell the result is visible immediately without the need for performing the steps mentioned above. Programmers don't have to save, compile, link and run the executable and there is no need even to switch the active window.
There is no miracle of course: Excel works sequentially in the background but hides this sequentiality from the programmers.
In the previous chapters we have reviewed how Excel queries the justification of the sequentiality and what a revolutionary answer it gives for the problem. Notice that eliminating sequentiality is not only a buzzword but a radically new approach which can change our programming paradigm in the future.
Integration of computer games and spreadsheets has tightened during the evolution of computer technology.
At an early stage this integration among the the games and spreadsheets was comical, e.g. they were installed on the same hard disk, or the purchased games were listed in an Excel sheet. Later the integration has tightened, as some games introduced a built-in spreadsheet (accessible by the "boss key" feature) - or Excel contained some built-in 3D games as Easter Eggs.
Now we have arrived at the next step of this integration, as Excel's cutting-edge 3D functionality is not hidden in Easter Eggs anymore but can be accessible publicly and easily. Excel has grown up and started its conquest as a revolutionary 3D game engine.