Simulation Overview

simulation-overview

To get a better understanding of our software architecture and the processes that make TraVis work, we recommend reading the following UML. For more in-depth details and examples read the papers listed below.

If you want to learn more about the Simulation Overview, you can download the technical paper on this topic.

DOWNLOAD

The Dataflow

dataflow The Dataflow inside of Travis is divided into three distinct layers. We called them the Data, Communication and Presentation Layer. The subject of the Data layer is to read and store the information of the Missionlog .csv file, and make them accessible via code. Inside the Communication Layer, the Data, which was made accessible in the previous layer, will be converted into an format which can be used inside the Unreal Engine. Afterwards the adapted data will be used inside the Presentation Layer to make the changes visible.

If you want to learn more about the Dataflow, you can download the technical paper on this topic.

DOWNLOAD

The Heightmap

heightmap The Unreal Engine Editor provides the possibility to import a heightmap to create a landscape. One of the requirements on TRAVIS was, to load different mission related data on runtime. The Unreal Engine offers this specific solution only during the runtime of the editor. This means that every engine code which implements the import of a heightmap is only initialized during editor runtime. Using this code would also imply a copyright violation, because using editor code in a packaged software is not allowed by Epic Games1. All in all it is not yet intended by epic to provide a heightmap import routine outside the editor. A good solution for our problem seem to be PMC. Hereinafter should be described how PMCs function and how we used them to implement our deep sea landscape.

1. "Terrain Editing in Runtime", UnReal Engine Forum

If you want to learn more about the Heightmap, you can download the technical paper on this topic.

DOWNLOAD

Aquarium

Aquarium Generation
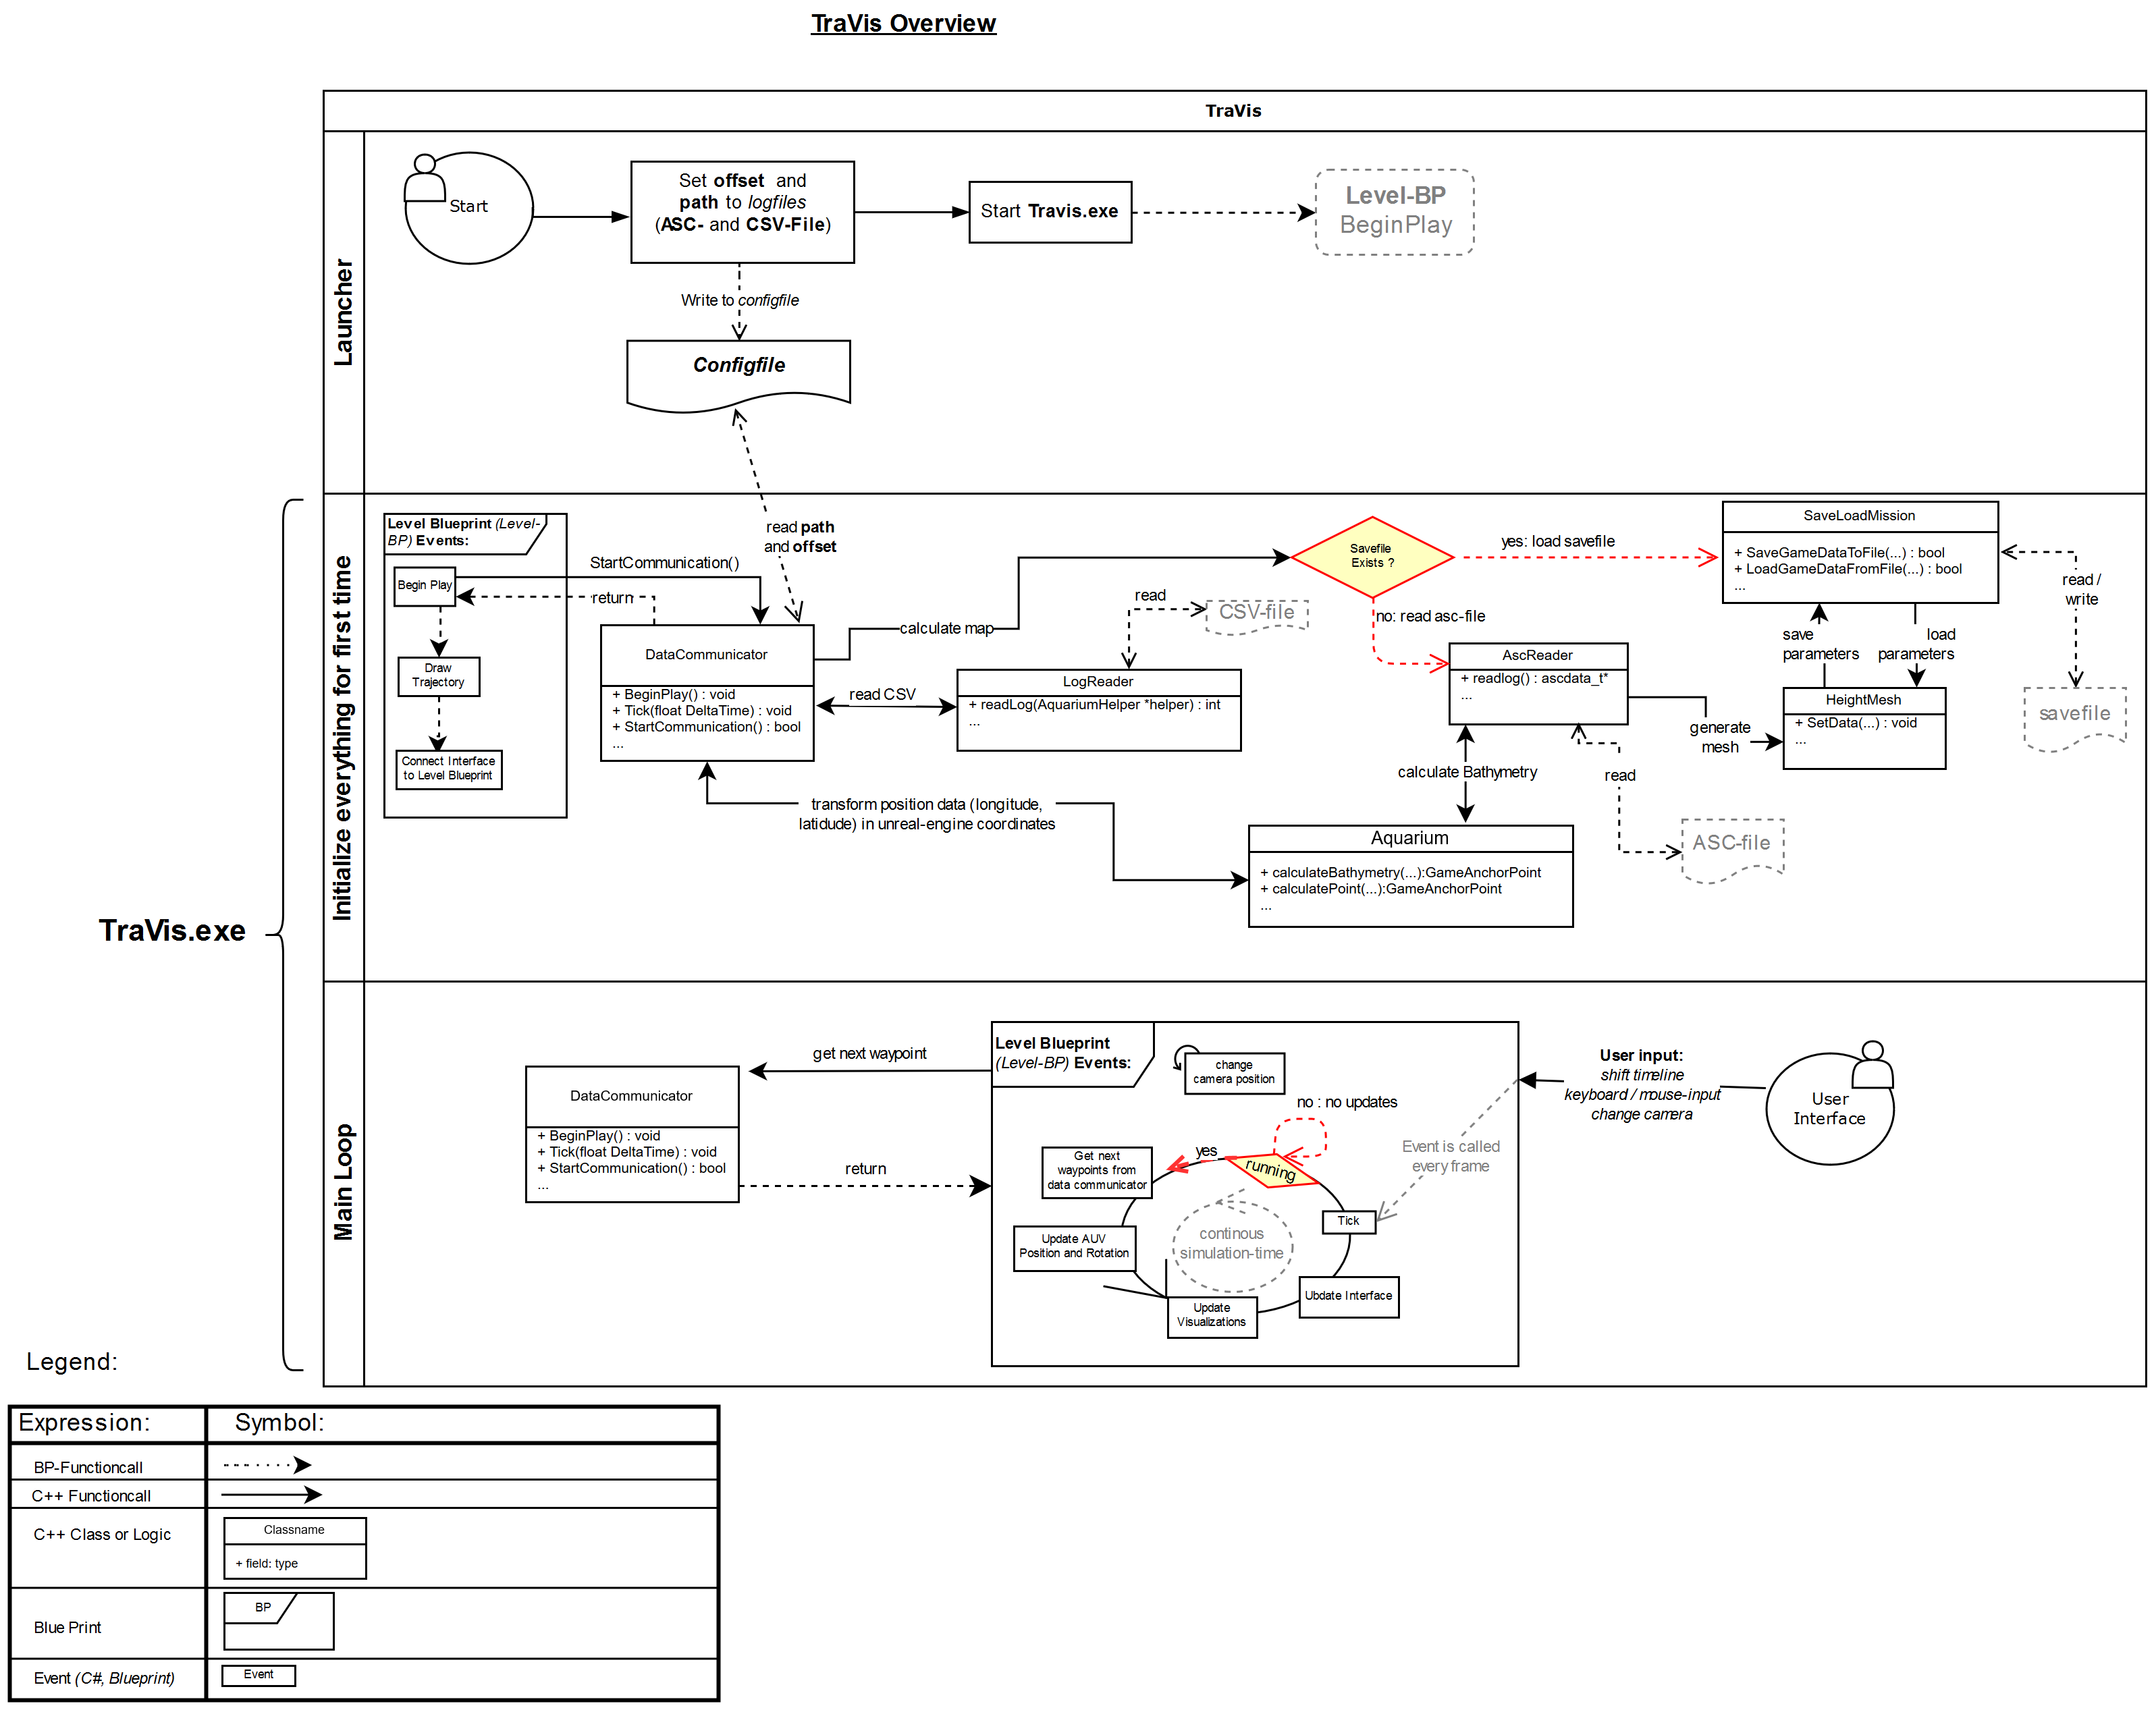
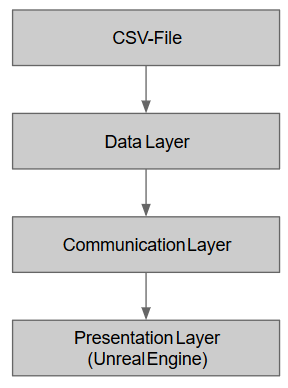
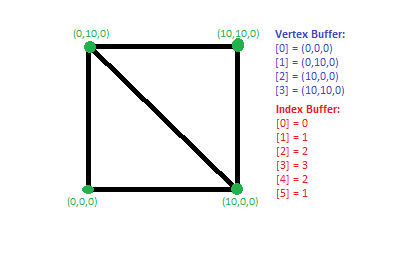
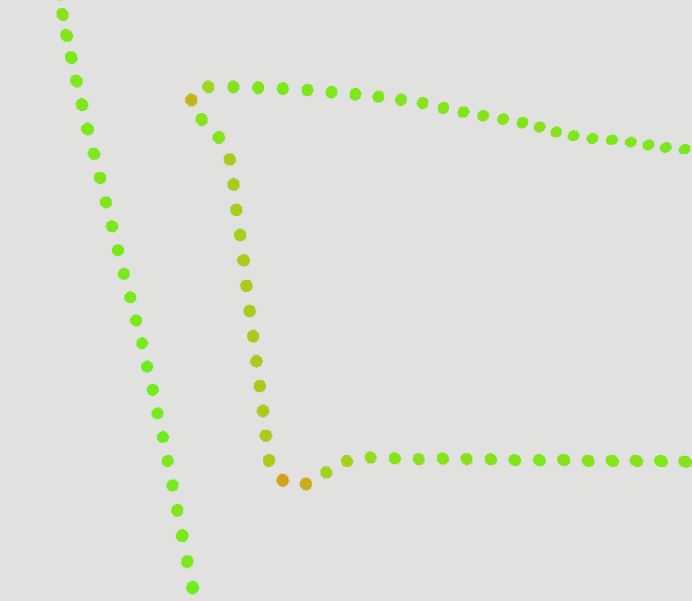
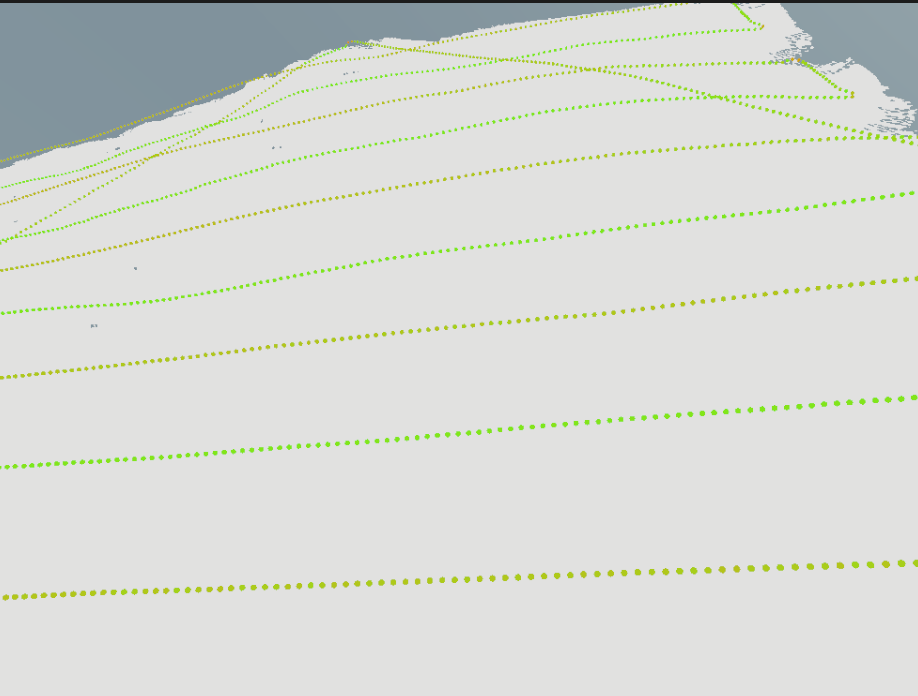
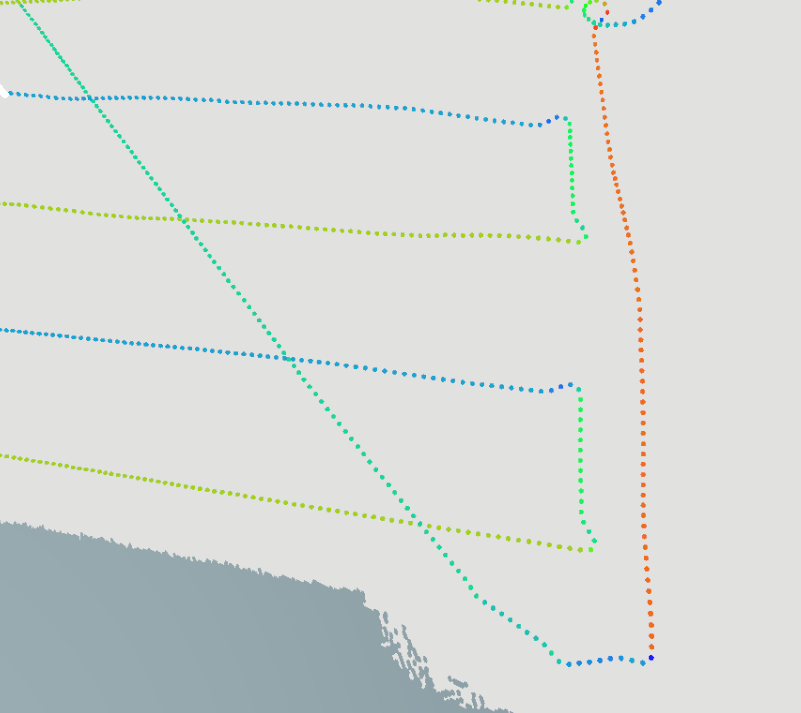
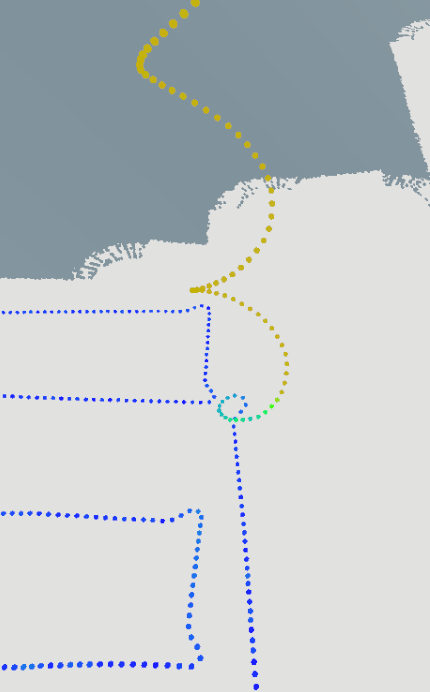
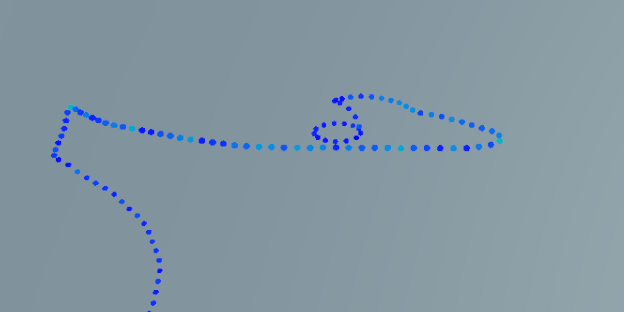
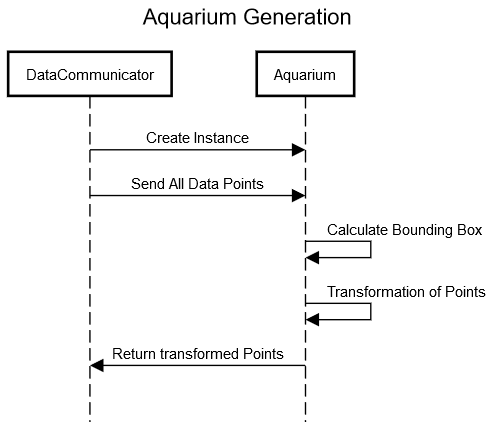
Travis will run in an simulated environment, specifically the Unreal gaming engine. Because we do not know how large the simulated terrain will be we need to specify a part of the map in which the simulation will take place. The Box in which the simulation takes place is called \textit{aquarium}. Inside the aquarium every point is described with x, y and z values. In the real world our reference system would you the latitude, longitude and depth values to describe an specific point where the AUV has been. In order to calculate the width of the aquarium, we need to consider the bottom-left and the bottom-right point of the data (e.g., the lowest latitude and the highest latitude in the log files and an arbitrary but fixed longitude value) and calculate the metric distance between these points. This is done with the Haversine Formula.

If you want to learn more about the Aquarium, you can download the technical paper on this topic.

DOWNLOAD

Trajectory

OverviewOne of the key features of the TraVis simulation software is the ability to show the AUVs trajectory in 3D as shown in Figure OVERVIEW. This visualization enables the user to get an easy overview over the AUVs movement in space especially in regards to the other parts of the simulation like the landscape. The trajectory is drawn using three-dimensional spheres which collectively form a dotted line from the missions start point to the endpoint. This mechanism is further utilized to make collected data overseeable within the simulation by projecting color coded data on the spheres depending on their position. This can help to make effects visible that might not be visible otherwise or help with resolving errors e.g. by uncovering when an error first occurs. Currently six different data sets can be projected on the visualization: rotations per minute of the motor, speed, pressure, heading angle (direction of movement), pitch (ascend or descend angle) and roll (rotation around the long axis). In the pictures NUMBER to NUMBER one examples for a possible use for the projection of each data set is given:

  • Motor RPM
    Motor RPM
    In the picture MOTOR RPM the effect of cornering on the motor rpm (and through this on the energy consumption) becomes visible: After each turn the AUV needs to speed up again and does this by increasing its motor rpm.
  • Speed
    Speed
    Figure SPEED shows the effect of ascends on the AUVs speed: The AUV moves back and forth over the ascending seafloor loosing speed in the one direction and gaining speed in the other due to the ascending/descending nature of the seafloor.
  • Pressure
    Pressure
    The pressure visualization, as shown in figure PRESSURE, can be used to examine whether the AUV (which is usually using altitude over seafloor for its controls and not depth) is operating within its pressure limits the whole mission.
  • Heading Angle
    Heading Angle
    Using the projection of the heading angle on the trajectory, as shown in the figure HEADINGANGLE, can help to clarify the trajectories visualization by showing the direction the AUV was moving through a complex three-dimensional path.
  • Pitch
    Pitch
    The pitch visualization, as shown in figure PITCH, can be utilized to check whether the pitch was correct during the recording of the bathymetry: During recording the AUV should be as horizontal as possible to prevent contortions, only when not recording (e.g. while descending) a large pitch is acceptable.
  • Roll
    Roll Angle
    To ensure proper functionality of the instruments the AUV is kept upright around the roll axis the whole mission so a large roll angle is a strong indicator for severe malfunction. Only at the sea surface some roll might occur due to waves, as shown in figure ROLL.

If you want to learn more about the Trajectory Visualization, you can download the technical paper on this topic.

DOWNLOAD

The 3D Visualization

TRAVIS does not only display the AUV and its movement, it also displays a lot of different data! While some of the data is mapped onto the trajectory and other is displayed within the UI, some data is visualized directly within the 3D enviroment. Our 3D visualisation solution (as seen in the Gallery) is a handy and easy to understand way of displaying data to the user within the 3D simulation itself.

If you want to learn more about the 3D Visualization, you can download the technical paper on this topic.

DOWNLOAD

The AUV Model

The AUV(short for autonomous underwater vehicle) model used in the TRAVIS simulation contains various individual parts, moving independently to display the mission data in real time and accurate. Each individual part of the model is textured as detailed as possible, under the condition of also ensuring an appropriate frame rate.

To view images and the 3D model of the AUV, click here

The Project Website

This website was designed and developed as a part of the TraVis project for the purpose of presentation. It was created with the use of Bootstrap v4.1.


If you want to learn more about the Project Website, you can download the technical paper on this topic.

DOWNLOAD